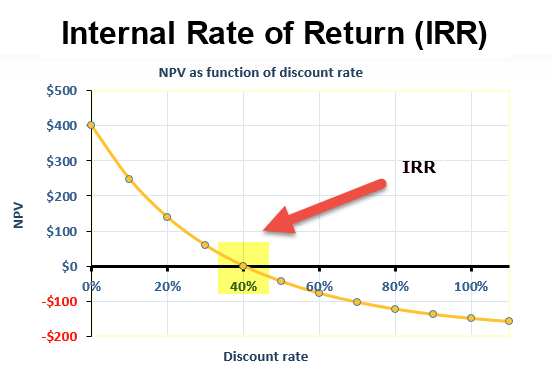
The NPV profile is plotting the dependent variable (NPV) as a function of the discount rate. It would make sense that for any discount rate below the project’s generated return rate, you have a positive NPV (i.e. the difference in discounted benefits and costs are positive). What would happen if the project generated a lower rate of return than your (weighted) cost of capital for the project? Well, we would be losing, overall, and the NPV is negative; this indicates we shouldn’t take the project. What happens if our cost of capital is precisely equal to the rate of return the project generates? Well, then we would be indifferent to take on this project because it provides us nothing and we lose nothing, overall; this is the case when NPV is 0 (this excludes intangible things not factored in to the NPV analysis).
So, we should clearly see that the NPV is 0 on the Y-axis (crosses the X-axis) when the project generates a return equal to the cost of capital (project IRR = project return rate).
Would be so cool if it was possible of someone showing me on a graphic how is it done through for better understang, but this is not possible through. I think this questions that you need to think on how the graphics would look like the hardest ones.
Crossing the horizontal axis is the same thing as NPV=0. So, where is NPV=0? At what interest rate does NPV=0???
Undiscounted means interest rate =0. If the discount rate =0, then NPV is just the sum of the cashflows. If the project is profitable (unprofitable), then the NPV will be positive (negative).