Im still having some issues with understanding the concept of when to use the table below:
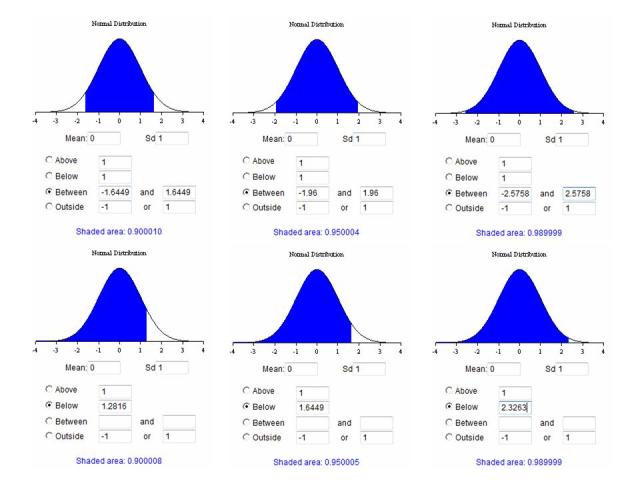
So the rule: Confidence intervals for any normally distributed random variable are:
90%: μ ± 1.65 standard deviations.
95%: μ ± 1.96 standard deviations.
99%: μ ± 2.58 standard deviations.
The below question is asking for a 95% confidence interval, the Sd i used was 1.96 but in the solution in the Qbank they used the Sd from the Student’s T-Table (Degrees of freedom = 25 − 1 = 24 and thus From the student’s T table, t5/2 = 2.064). I still got the right answer because the numbers are very close to each other, but I guess what im wondering is, when do we use the above Sd and when do we refer to the tables?
Is is because this was a small sample, smaller than 30 we use the t table? Thanks for clarifying this.
A random sample of 25 Indiana farms had a mean number of cattle per farm of 27 with a sample standard deviation of five. Assuming the population is normally distributed, what would be the 95% confidence interval for the number of cattle per farm?
A) 23 to 31.
B) 25 to 29.
C) 22 to 32.
The standard error of the sample mean = 5 / √25 = 1
Degrees of freedom = 25 − 1 = 24
From the student’s T table, t5/2 = 2.064
The confidence interval is: 27 ± 2.064(1) = 24.94 to 29.06 or 25 to 29
Well the former rule you mentioned is used for z statistic (refer to p286 schweser’s note) In case the sample size is small (n below 30), the population is normally distributed and unknown variance: use t-statistic (refer to table in p289 schweser’s note)
@gekko: As you can see in the table in p289 Schweser’s note, in case we can use z statistic, the above rule can work for constructing confident interval
I’m wondering about this too. Can someone shed some light regarding this?
Sometimes, when they ask you to create a Confidence Interval, you use mean +/- z(standard dev): example on page 255 of Schweser book 1.
The average return of a mutual fund is 10.5% per year and the standard deviation of annual returns is 18%. If reutnrs are approximately normal, what is the 95% CI for the mutual fund return next year?
Answer: 10.5 +/- 1.96(18)
However, on page 287 of Schweser book 1, they use a different formula to calculate CI, using mean +/- z(standard dev / root n):
Consider a practice exam that was administered to 36 Level I candidates. The mean score on this practice exam was 80. Assuming a population standard deviation equal to 15, construct and interpret a 99% CI for the mean score on the pracice exam for 36 candidates.
Answer: 80 +/- 2.58(15 / root 36)
What’s the difference between these two calculations? They are both normal distributions with known variances. This could be a dumb guess…but do we use the standard error in calculating the CI when n is actually given? Since we don’t know n for the first example for the mutual fund…?
The difference between these two calculations lies in the fact that Q1 asks you about a member of the population (mutual fund return) while Q2 asks you about a MEAN score for 36 candidates.
I suppose in the first case, n=1 and in the second case n=36. sqroot of 1 =1
You only use sd/“sqr root of n” when the question involves a sample of the population. See in Q1 it’s a mutual fund and Q2 gives u a sample of 35 candidates. The mutual fund by itself is the “population” whereas 35 candidates is a sample of a couple of other thousands candidate. You have to calculate the standard error since its a sample of a population.