But it’s not the definition you are putting across. It still means the volatility of the underlying’s price. Not the volatility of the volatility of the underlying’s price (whatever that means). I’m not sure how the MCS works, but something is definitley off. If we calculate historical volatility of an index (for example), the mean return turns out to be 2%, and the SD is 30%, that doesn’t mean the return is 99% rangebound within ~0 and some number, does it?
I’m too tired today to keep it going, one last interesting thing I found concerning the probabilities, it’s calculated by:
ln 19.36 + (0.02-(.3^2)/2)*.5 = 2.95
0.5^0.5 * .3 = 0.2121
ln 20 (strike price) = 2.9957
N((2.9957-2.95)/0.2121) = N(0.2123)
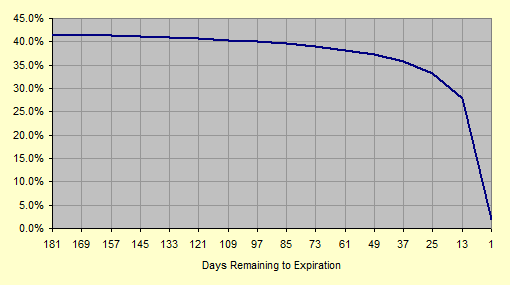
Probability = 1-N(0.2123) = 1-0.5833 = 41.67%
That’s how it was calculated previously.
Here’s a graph for it plotting against time.
Sorry I can’t keep up at pace right now, statistics and numbers were never my cup of tea.
Alas, it is. It’s the standard deviation of the returns. That’s what I’m varying: the returns.
Alas, it doesn’t. The price can have a nonzero standard deviation even if the returns have zero standard deviation. They’re related, of course, but are not remotely the same thing.
Of course it doesn’t.
But it does mean that if you compound 180 such periods that are statidtically independent, you’ll get an ending price that’s pretty darned close to the beginning price increased at 2% per period.
Consider a 180-day option. I create a normal distribution for the continuously compounded return with a mean of 1.9803% and a standard deviation of 30%. For each of the 180 days, a random return is selected from that normal distribution, and converted into a 1-day effective return. Those 180 daily effective returns are compounded to give the 180-day effective return. The spot price is increased by that 180-day effective return, giving an ending price.
This process is repeated 100,000 times to get a distribution of ending prices. The percentage of those ending prices that are above the strike price is the probability that the option will be executed.
If you look at the explanation of volatility on that website, they describe it as the annual volatility of the underlying asset’s price.
In the BSM model, σ is the annual volatility of the underlying asset’s _ return _, not the underlying asset’s price.
I may have mentioned this before.
I don’t know whether they simply made a mistake in their explanation, or they’ve made a mistake in how they’re using volatility. I suspect the latter.
I haven’t time at the moment to create a simulation varying the asset’s price, but I’ll work on it later when I get home.
By the way, this return/price confusion appears in other areas in finance, and is something I find immensely frustrating; finance people are notoriously sloppy in their language, and it leads to sloppy thinking.
Right, I missed a zero. The μ wasn’t the point though, and won’t change the results, the σ vastly outweighs the mean.
I believe you are the one mistaken. If we take a daily series of compounded returns defined as ln(s1/s0), then take the sd of that series, it would be the volatility of compounded returns like you said, but one which affects the lognormal price process, not the volatility of the mean compound return in a binomial brownian motion. It becomes a random normal distribution for each period generated using the same units, again, like I’ve said earlier, is where the mix up happens. While you were using the sigma as a measure of dispersion on the expected return itself, as opposed to it’s original method of deduction.
See how variable the returns turn out in my example compared to yours? You are effectively using static volatility. Which explains the discrete jumps in probability as the spot price approaches k.
For the very next period, using a binomial model, the spot can have a price of: (Let’s ignore the certainity price due to it’s insignificance, so it’s actually biased to the downside)
U = 19.36 * e^1.58% = $19.67
D = 19.36 * e^1.58% = $19.057
Try running a simulation using the above for 180-periods, and calculate P(>$20).
Learned some new stuff this past day from researching for this topic. I know I’m being persistant, you’ll come around eventually.
As I was heading over to the barn to go horseback riding I was thinking about the BSM formula for _d_1, and it finally penetrated the concrete: rf + _σ_²/2, not just rf.
You’ll be happy to know that when I just reran the simulation with the correct parameters, I got P(exercise) = 50% for a 50-delta call (30% volatility).
Whew!
(Note, however, that although the numbers are going to change somewhat, my overall conclusion is unchanged: the option’s delta is not remotely a good approximation to the probability of exercise, except when delta is 0, 0.5, or 1.0. I’ll edit the numbers I posted above when I’m through each set of simulations.)
Except for it appears wrong and the rule of thumb that delta is an approximation for the in-the-money probability seems more correct. I thought S2000 was going to refine his figures and repost, but I guess he got busy.
I think even S2000 would admit that delta IS IN FACT used as an approximation of the liklihood of expiring in the money. I used to work in the options pits and know with certainty that professional options traders consider that a rule of thumb (though not an exact science). I think S2000’s point was just that: delta IS an approximation but that it’s not necessarily always accurate. Anyways…
I also asked a friend to run some calculations to see if I had made any material mistakes. He confirmed my numbers.
I also contacted the people at the website that onlysimon had posted, to try to determine why their numbers are considerably different from mine. I’m still awaiting their reply.
I want to make sure that what I’m doing is accurate.