Hey guys!
I know most of you are equity-centric people, but curious if anyone has done yield curve modeling in Excel. I’ve created a parallel shock Economic Value of Equity (EVE) model to value one type of account on the balance sheet. Sometimes parallel shocks aren’t necessary and a non-parallel shock should be applied. The model currently does 8 interest rate shocks (4 up, 4 down). I want an easy way to apply the *same* type of nonparallel shift in each situation.
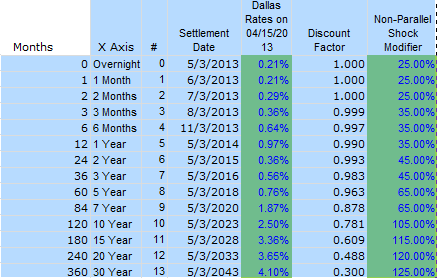
Currently the only way I can think to accomplish this is what a modifier, like below:
If anyone has done anything like this before and has any tips on how they did it, I’d love to hear 
Thanks
I don’t think there’s ever been an exact parallel shock ever.
I would use the ‘rand’ function with appropriate standard deviations for each key rate.
Oh I know that. But in terms of risk measuring, a lot of times parallel shocks are used to expose the risk in EVE. But sometimes optionality lays on different ends of the curve, making non-parallel shocks useful to expose the risk.
^This
Just to make a monte carlo. Rates are mean reverting and lognormally distributed. I’d do something like this:
http://www.r-bloggers.com/fun-with-the-vasicek-interest-rate-model/
Gives you rates at T-0 and a mean reverting level for T-N and plenlty of random walk.
^This actually requires a fair bit of sophistication to do it properly. Inflation expectations are a very significant input into long-term yields. And monetary policy significantly impacts short-term rates, which in turn depends on growth vs. inflation. Also, short-term rates are bound by zero, so you need to account for that. For the yield curve, several of the rates are cointegrated over time and also correlated with each other, so you also have to incorporate that.
Rather than try to simulate yield curve dynamics, a simpler approach is to apply a Nelson-Siegel decomposition (basically a regression that uses explicit level, slope, and curvature factors). Get the error and then adjust the coefficients from the regression to produce different yield curves.