From Kaplan: The most appropriate measure of the degree of variability of the actual Y -values relative to the estimated Y -values from a regression equation is the (SEE) standard error of the estimate.
Then what is an easy to understand description of the Sum of Squared Errors (SSE) in comparison?
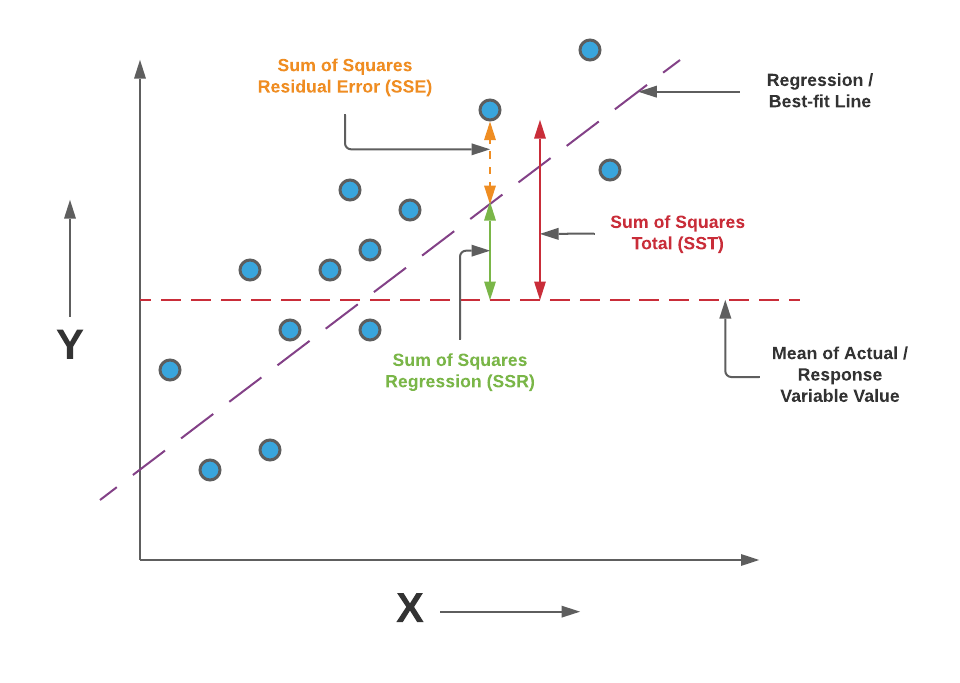
In the absence of a linear model, I could just use the mean of Y as my best guess for actual Y, regardless of what X is. But this line of best fit helps explain why Y changes as X changes. So SSE (square of fitted Y - mean of Y) accounts for that part of the deviation between actual Y and mean of Y.
Got it; the SSE is the difference between the line of best fit and the sum the squared errors that, obviously, don’t fall on the line of best fit. We square the errors to have all positive numbers, correct?
If we didn’t square the deviations or take the absolute value, then the deviations sum to 0.
That’s not the best-fit line. There are a lot more deviations above the line than below it.
Where’d you get the picture?
Is that assuming homoskedasticity?
Since there are more deviations above the line then below it, would the distribution be displaying heteroskedasticity?
No. (At least, not necessarily.)
The line’s just in the wrong place.
1 Like
I just copied a random pic to demonstrate splitting total variation into regression and error terms.
I do agree that the line of best fit should go through the scattergram of points, but I don’t recall hearing about how the points should be distributed above and below the line. As a test, I tried the following example:
(0,0), (1,1), (2,2), (3,4), (4,4), (5,5)
The regression line is Y = 0.0924 + 1.0287X, with 1 point above the regression line, while all the others are below. QED.
Of course you can have more points on one side than on the other. But if so, the side with fewer points will see them farther away from the line, on average, than the side with more points.
In this picture, however, the four points below the line aren’t significantly farther away from the line than the nine points above it.
And I just missed a question by incorrectly answering that one assumption about residuals of a linear regression is that the residuals are equal to zero; that was wrong.
Per your above point, the deviations sum to 0, not the residuals.
1 Like