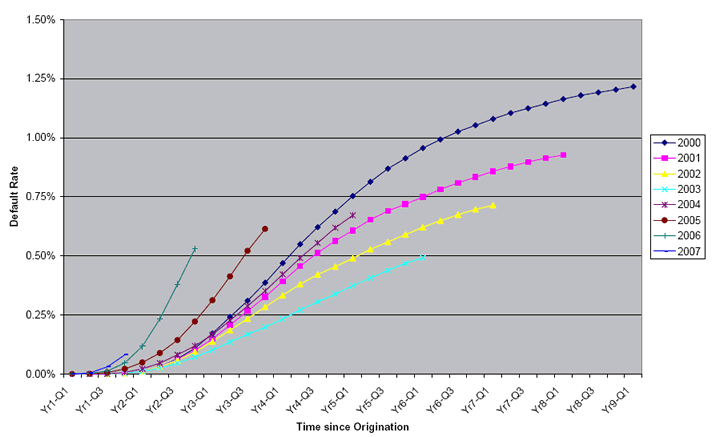
Hey, I have a ton of vintage charts similar to the one here: http://www.marketoracle.co.uk/images/2008/fannie-mae-cumulative-default-rates.png I need to update these regularly and I would like to label the last data point with the vintage instead of using a legend. I tried google and whatnot but can’t find a solution for labeling when the end of the series occurs at different points on the X axis. THANKS.
Click twice on the data point you want to label. At this point, you should have just that single point selected. Now right click on the point and select “Format Data Label”. Under Label Options, click on Series Name (or Category Name depending on how your data is set up) under “Label Contains”. This should add the label from the legend to just that data point. It won’t update dynamically (not sure that there’s a way to do that), but depending on how often you have to update it, that’s probably your best option other than labeling them by hand with text boxes.
I actually figured how how to do it. It’s sort of a convoluted process to get going, and involves a utility called XY chart labeler. Yet it works like crazy.